Actions
Feature #841
openERP Dashboard Charts Implementation
Status:
In Progress
Priority:
Normal
Assignee:
Pratyusha Atmakuri
Target version:
-
Start date:
08/07/2024
Due date:
25/07/2024 (about 9 months late)
% Done:
100%
Estimated time:
Spent time:
Deployed In:
Category:
UI
Files
Updated by Pratyusha Atmakuri 9 months ago
- % Done changed from 0 to 10
AM-Charts
Step 1:
      Call Area Data API https://{base_url}/HIMS_RRAMS/services/area/areadata from the response pick Linkcode column
      Call Survey Data API https://{base_url}/HIMS_RRAMS/files/import/surveydata from the response pick Survey Id
   Step 2:
      Form the JSON with this structure
      [{"lnk":"LI_MDR025B_515_0","SurveyID":"2023"}]
    Step 3:
      Call Dashboard Level API https://{base_url}/HIMS_RRAMS/services/dashboard/lvl/Home1
       and send Step 2 formated data to this API as a Payload It gives response for binding charts LinkSt
    Step4:
         Bind the charts data based on above step response
    Step5:
Align them and give a provision for Print and View Table with a Get RequestUpdated by Pratyusha Atmakuri 9 months ago
- File Dashboard_charts.mov Dashboard_charts.mov added
- Status changed from New to In Progress
- % Done changed from 10 to 40
Added Dynamic Charts and attached Video file
Updated by Pratyusha Atmakuri 9 months ago
- File dashboard-allcharts.mov dashboard-allcharts.mov added
- % Done changed from 40 to 60
All charts data is loading for column with multi series
Actions
#4
Updated by Pratyusha Atmakuri 9 months ago
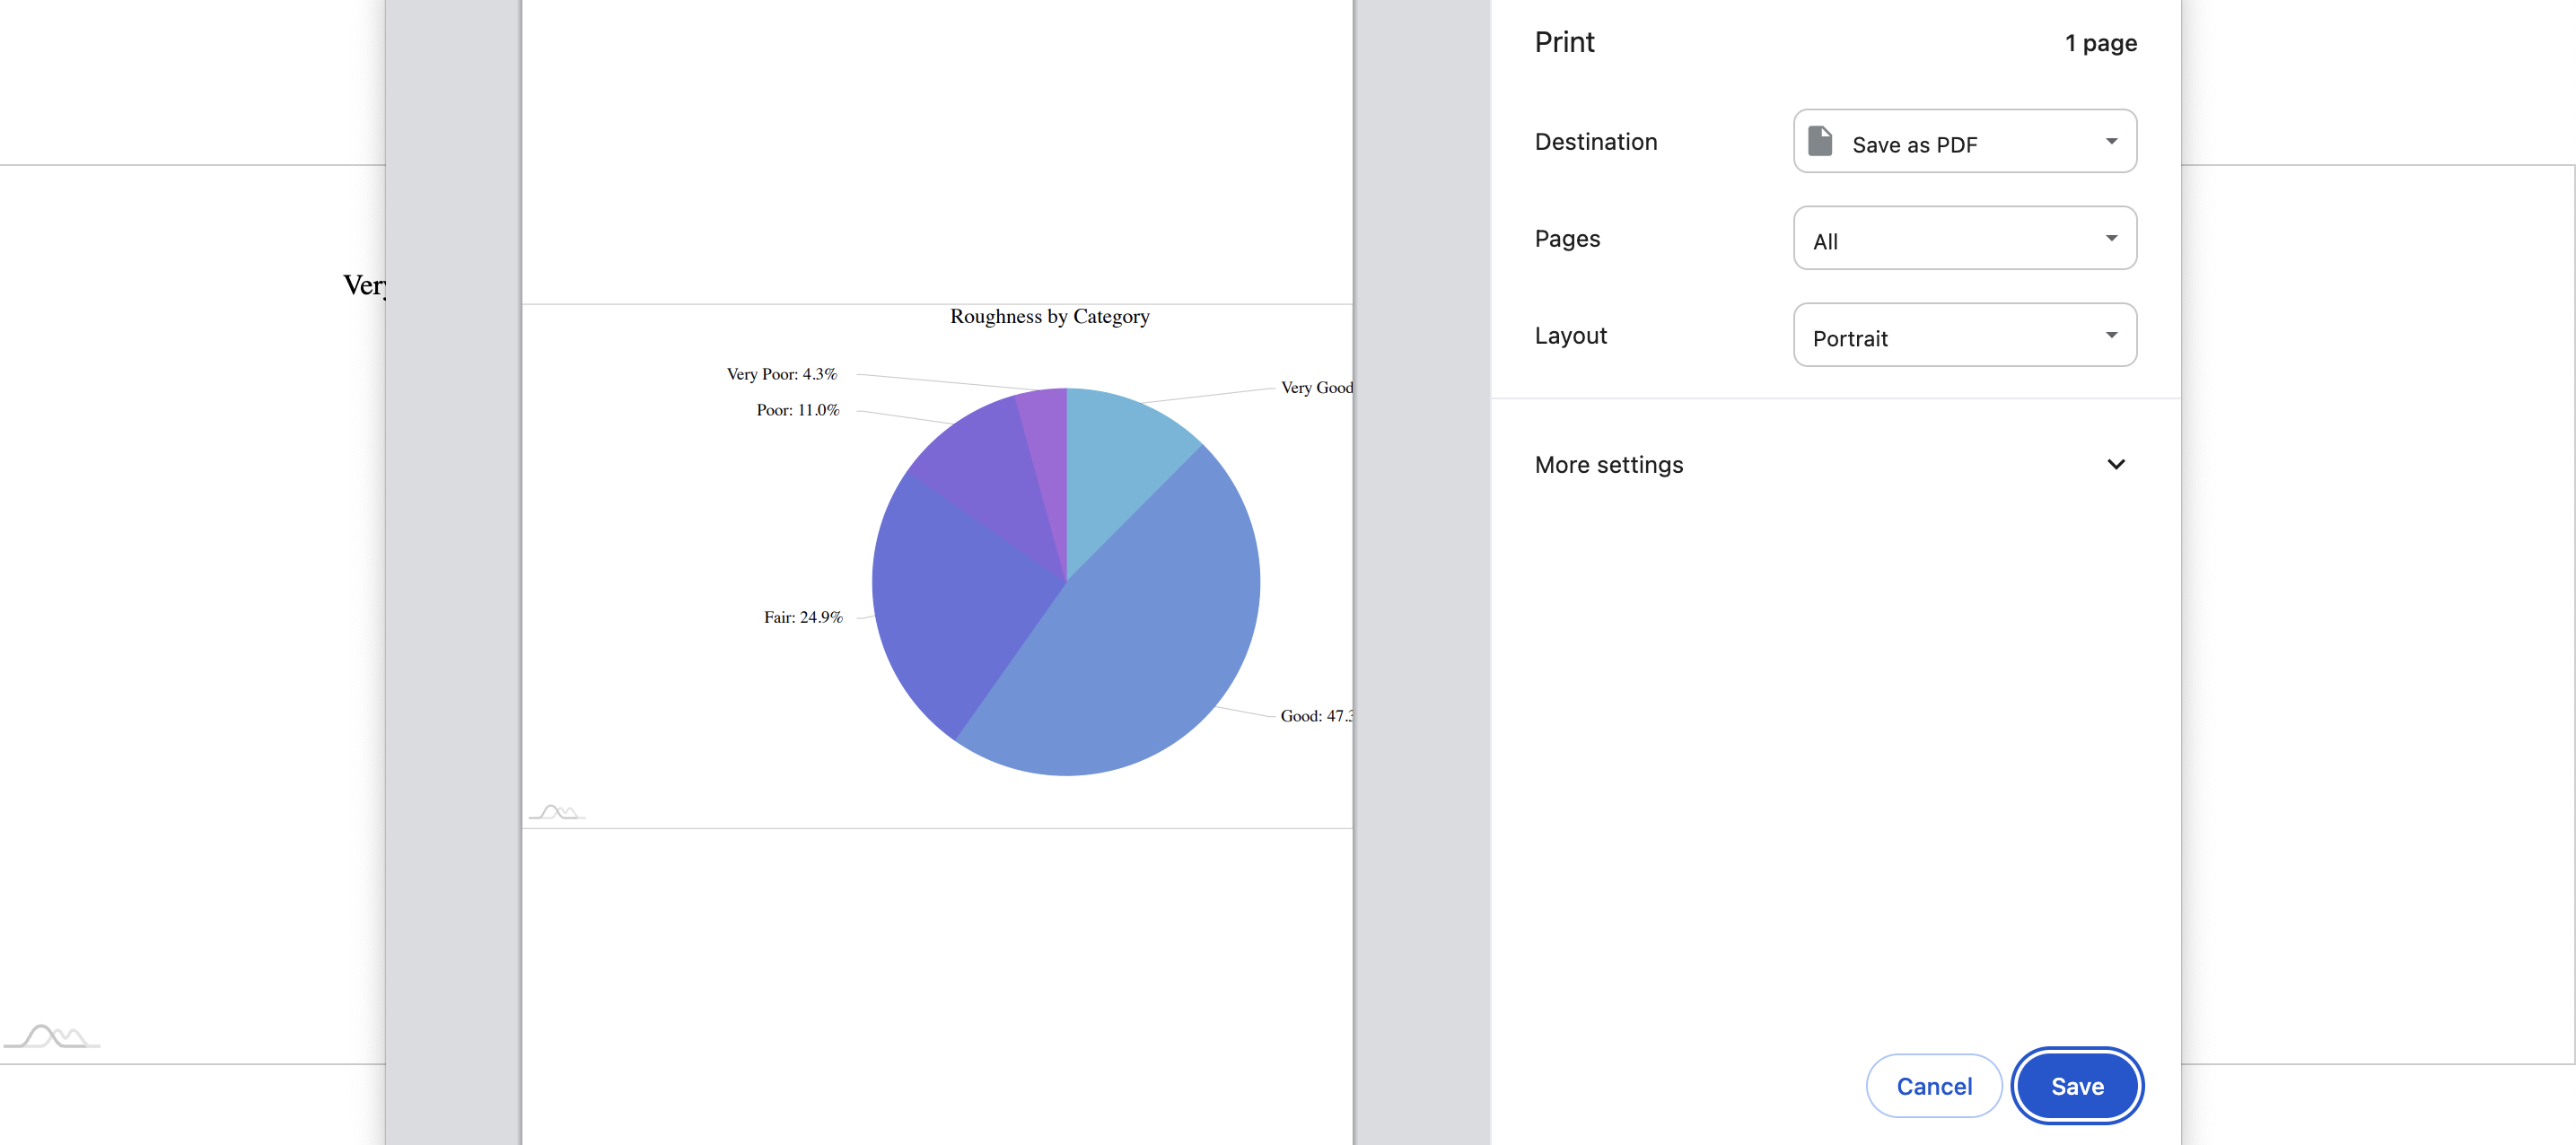
- File Print Chart.pdf Print Chart.pdf added
- File Screenshot 2024-07-15 at 8.26.23 PM.png Screenshot 2024-07-15 at 8.26.23 PM.png added
- Due date changed from 10/07/2024 to 18/07/2024
- % Done changed from 60 to 80
Print chart preview and pdf file are attached
Actions